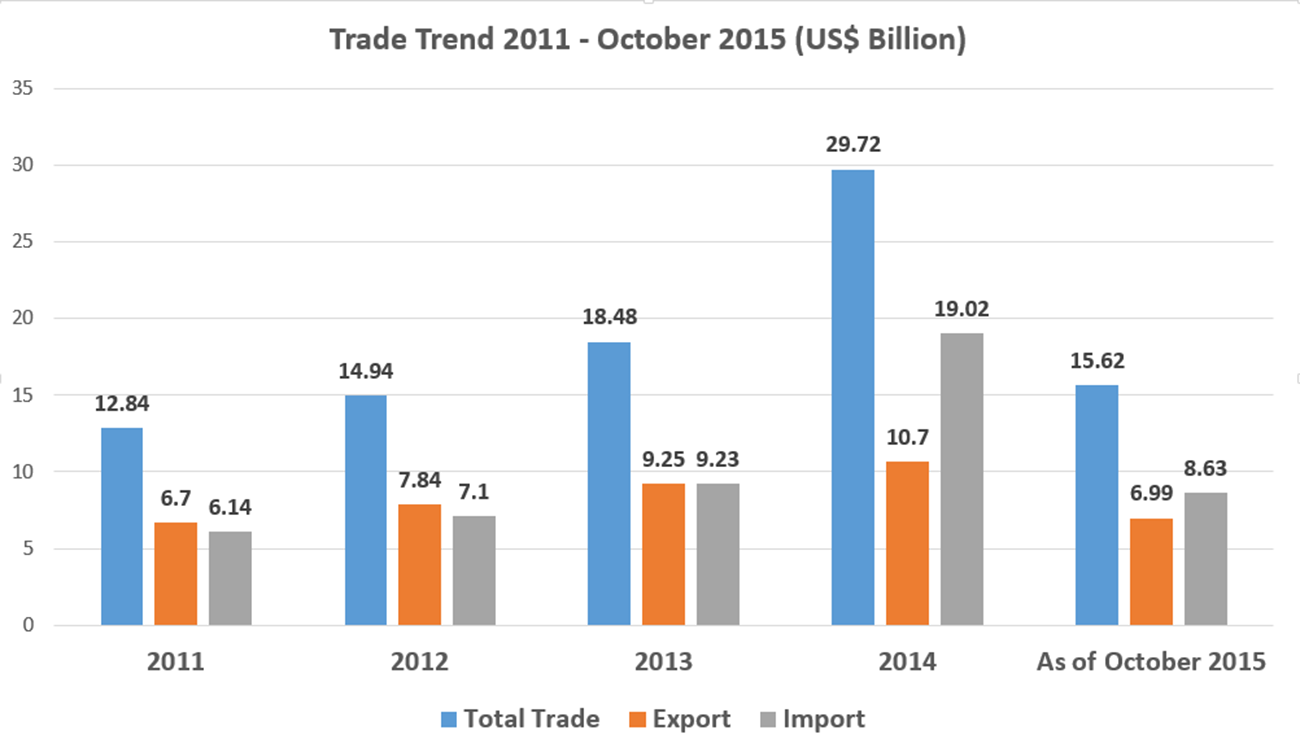
As of October 2015, trade volume was recorded at US$ 15.62 billion. The exports reached US$ 6.99 billion. The trading volume from 2012 to 2014 shown an upward trend with a sharp increase from US$ 14.89 billion in 2012 to US$ 29.72 billion in 2014 marking an increase of 99.60%.
1. Trade balance
As shown in below Figure, the trade performance of Cambodia has been active. The amount of export in 2011 is estimated to have grown by 3.1 times as much as that of 2002. However, since the imports have also kept growing, the balance of trade has remained in the red, quickly widening its gap since 2003. After the exports dropped sharply being affected by the world economic recession, the imports of production and construction materials also drastically decreased. In the last three years, the trade deficit has remained at moderate level.
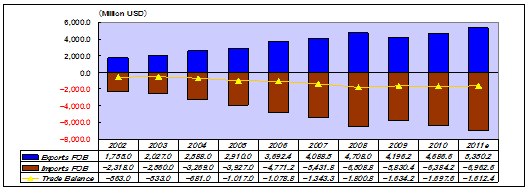
Source: Ministry of Economic and Finance, Cambodia
Figure II-3-1 Trade Balance: 2002 – 2011
2. Export Trend
Cambodia’s exports have shown continuous growth throughout the recovery period. According to Ministry of Economic and Finance statistics, exports reached approximately 5.4 billion US dollars in 2011 (below Figure). As shown in below Figure, GSP exports products such as garment and shoes have increase steadily from 2006 until 2008, decreased in 2009 and recovered in 2010 and 2011. Exports of other products also showed the similar trend. On the other hand, re-export products have continuously increased from 2006 until 2011.

Exports 2006 – 2011
3. Import Trend
Growth of Cambodian imports is much higher than growth in Cambodian exports, reaching approximately 7.0 billion US dollars in 2011 (below Table). The imports showed the steady growth from 2006 to 2008, dropped in 2009 and recovered in 2010 and 2011.Main imported products in 2011 were “garment sector” and “petroleum” by occupying the share of 22.6% and 30.2% respectively.
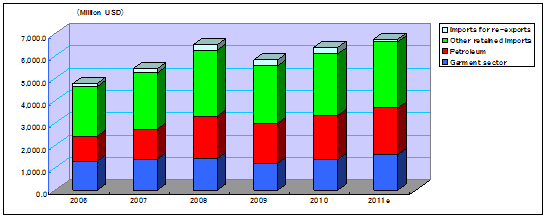
Imports 2006 – 2011
